Imagine that you need to buy a new laptop, but there are no specific models in your mind. What are you going to do? Most likely, you will first look for reviews on the Internet, ask friends for recommendations, read reviews, compare features and prices for the options you like, and only then you will make a purchase decision. All the same, only as applied to IT development, is called Pre-Project Analytics.
Why it is needed
Pre-Project Analytics helps to make a product tailored to the needs of the audience. What do we mean? At the start, it is not always clear how the product should look like, what features it needs, how much time the development takes. As a result, you can end up with a solution that looks great at first glance, but does not respond to the needs of its target audience at all.
With the help of Pre-Project Analytics, you can:
- Determine the structure and functionality of the future product
- Form a common vision of the project
- Save time, money and effort of employees - since all the nuances emerge before the start of work, and not during or after. That means that then you don’t have to redo anything
- Find more effective ways to solve the problem than those set in the TOR (we had a case when the customer wanted a full-fledged automated logistics system - but it turned out that it was cheaper for him to hire a manager, and we developed for him a solution for automatic notifications of applications)
Is it possible to avoid doing it?
Actually, it’s possible. However, only in certain cases: for example, if the customer came with a ready-made TOR, design and a clear understanding of the result (but such situations happen very rarely). We can go without pre-project research if we are doing a template project, such as a business card website or adding payment functionality.
Sometimes the idea of a product is so innovative that its analogs simply don't exist. Then, instead of full-fledged analytics, we can conduct marketing research and CustDev (identifying the needs of the target audience).
But if you don’t have a clear TOR, you are not sure about your understanding of the final product and its functionality, you need to test hypotheses or eliminate weaknesses in an existing service, then Pre-Project Analytics is a must for you.
How analytics is done
The analytics is carried out in several stages. Their number and sequence are rather flexible: depending on the project, some steps can be added, while others can be deleted. Here are the main ones that we follow.
-
Interview with the customer. At this stage, we try to collect as much information about the customer as possible: about his business, goals and objectives, audience and sales model. This helps to evaluate the current situation in the company, to understand what business task we are solving and what user needs we are addressing.
We interview not only leaders, but also performers and managers - everyone who is involved in the project. This helps to get a more complete and correct picture, since top managers don’t always know all the nuances of the work of certain business processes. -
Competitive analysis. The task of competitive analysis is to understand how user problems are solved in other products and how successful these solutions are. To do this, we study the solutions of the main competitors, look at their strengths and weaknesses, and stock up on ideas. As a result, we must create a USP - something that will favorably distinguish the product.
-
Structure development. The next step is to create a diagram that shows the structure of the future project, its elements and the connection between them. This diagram will form the basis of the Customer Journey Map and assist in developing prototypes.
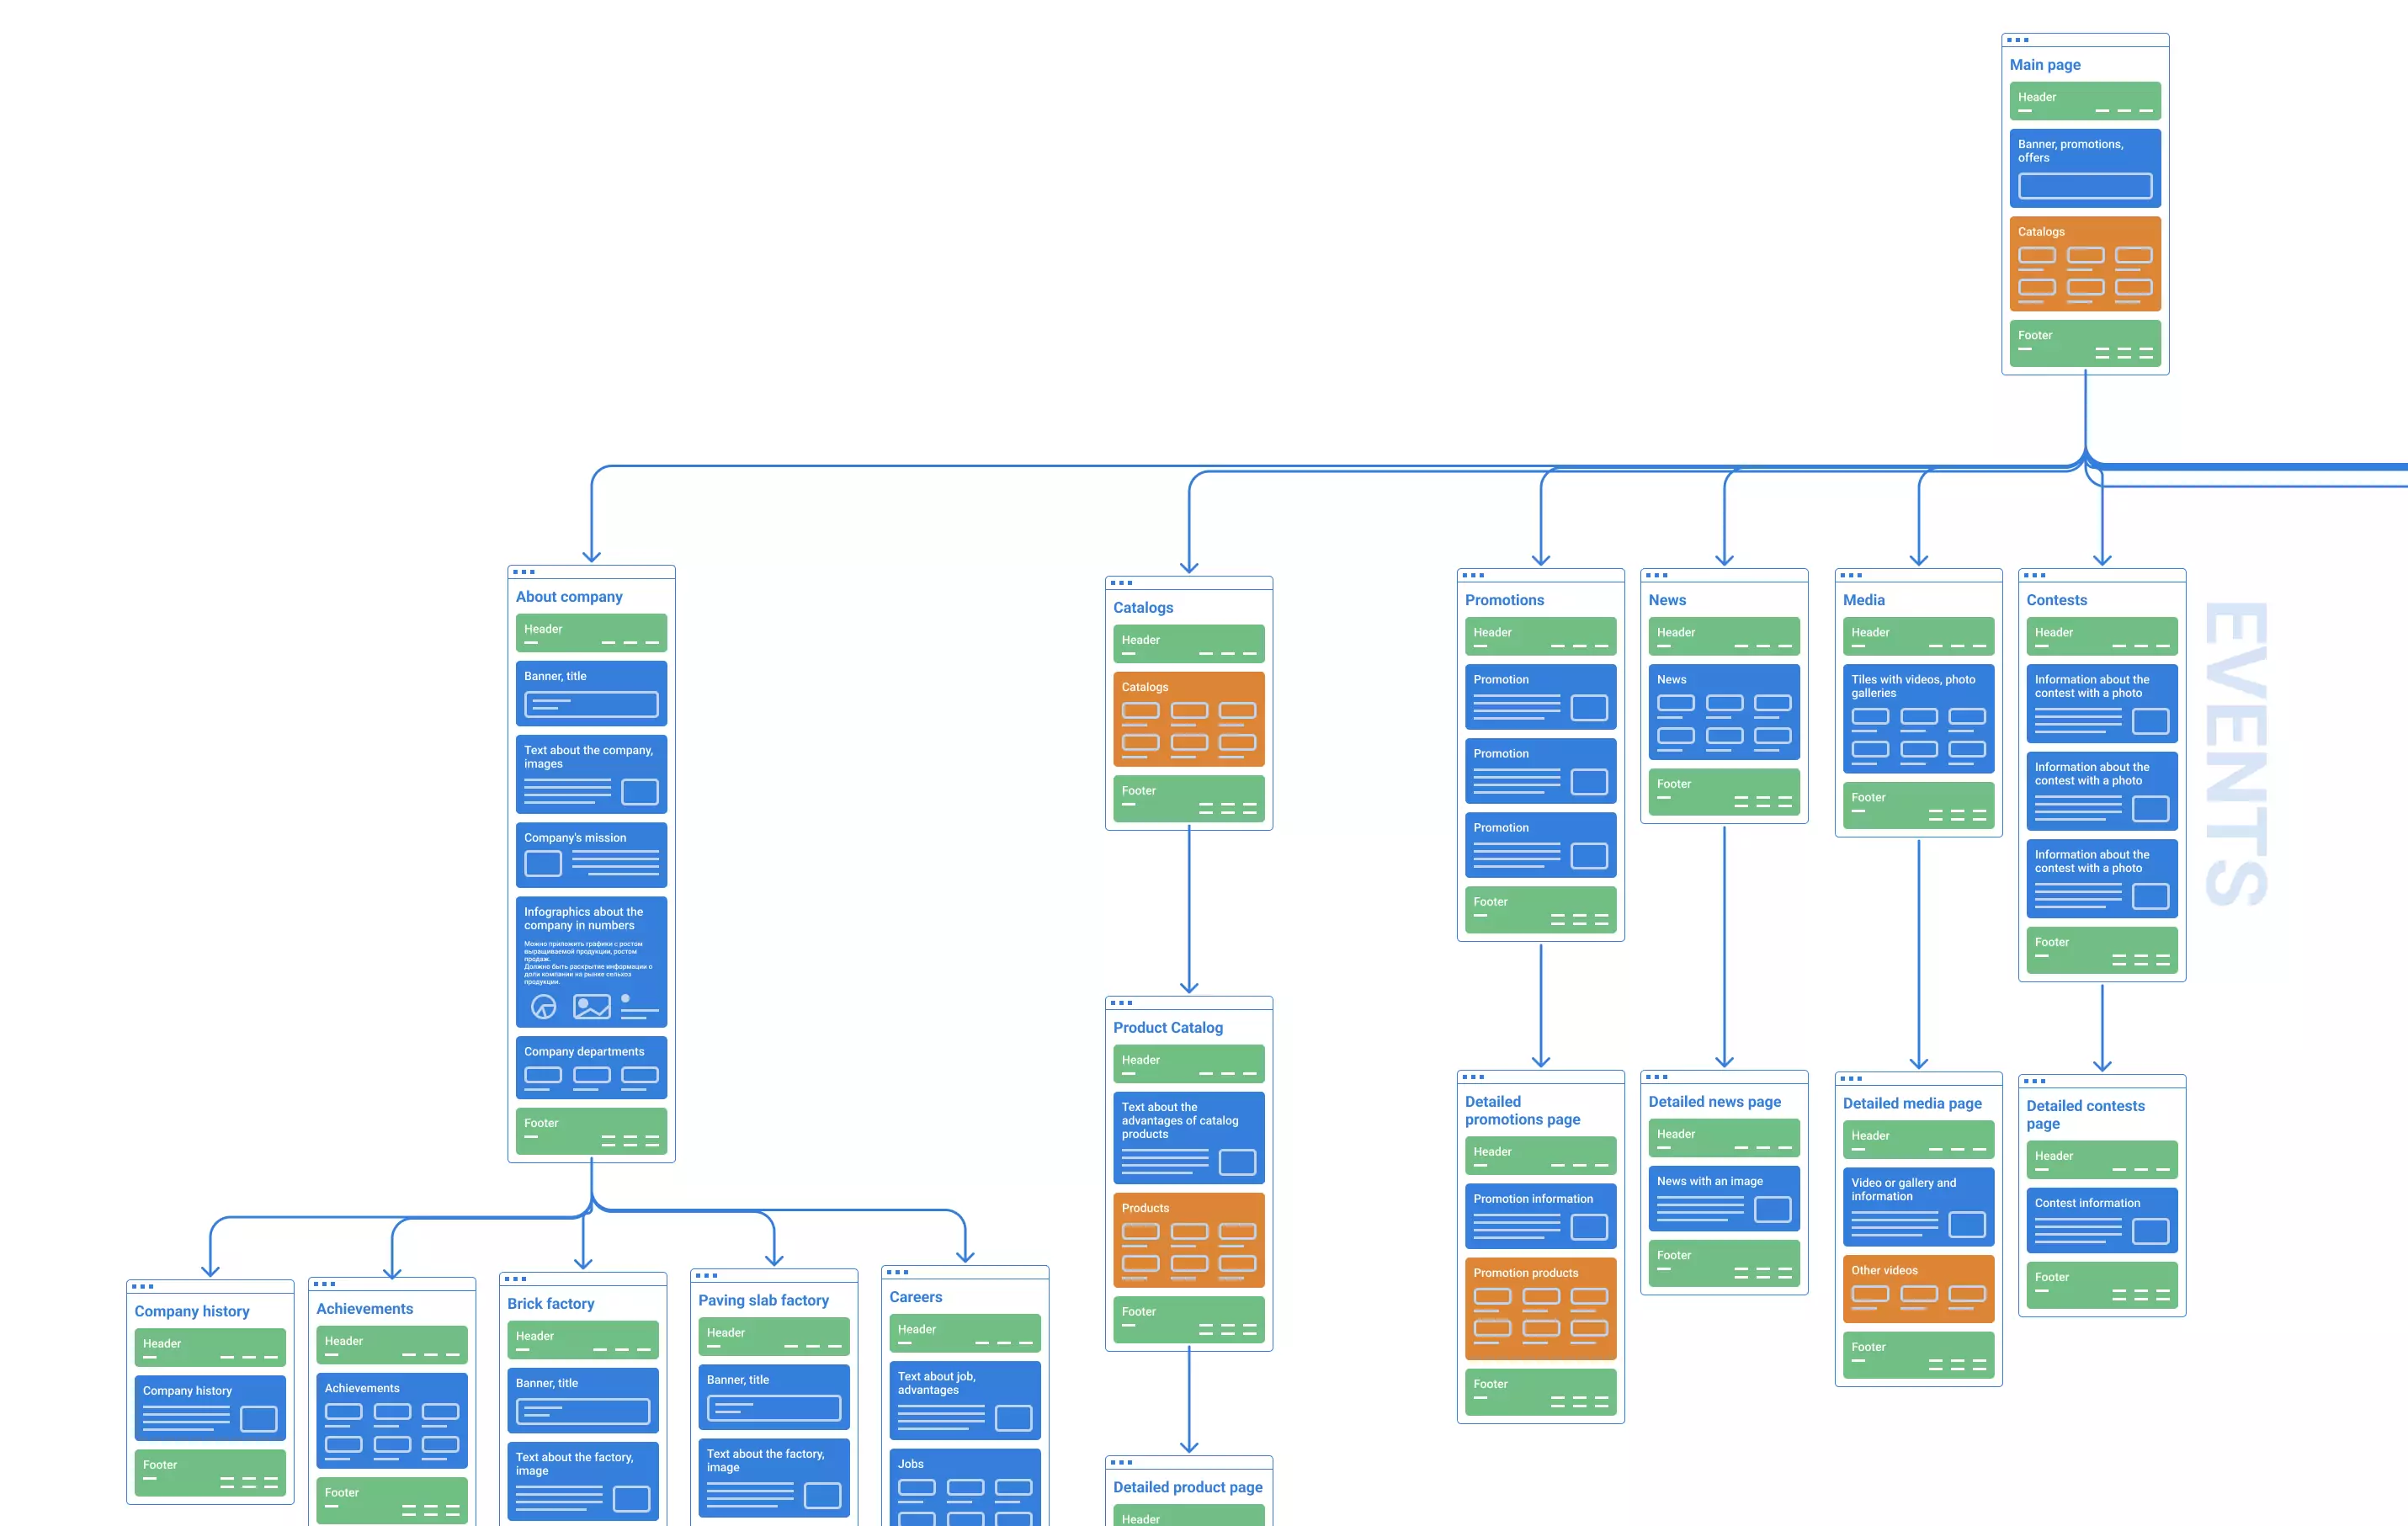
-
Creating a Customer Journey Map (CJM) reflects all scenarios of user interaction with the product: in what ways he can perform this or that action. Let’s take as an example product selection in a food delivery application. We look at how the client can go to the dish card: from the menu category, from the promotions section, from the history of their orders - and study the problems that they may encounter in each case. All this helps to see errors in the user journey in advance and fix them, and also to optimize scenarios that are too long or inefficient.
-
BPMN (Business Process Model and Notation) is a model that describes the business processes associated with a product in a flowchart format. In fact, it reflects the logic of the product’s work and allows us to understand how best to develop it.
Coming back to the food delivery app, here we will have to detail how the restaurant receives the order, how it is given to the kitchen, how the courier is appointed, and so on. All this requires deep immersion in the customer’s business, which means reducing the likelihood of misunderstandings. -
Prototyping. This is the final stage of analytics, where we, together with the customer, prepare prototypes - a kind of sketches of a future project that show how it will work. In other words, they demonstrate its structure, functionality, and scenarios of user’s interaction with it.
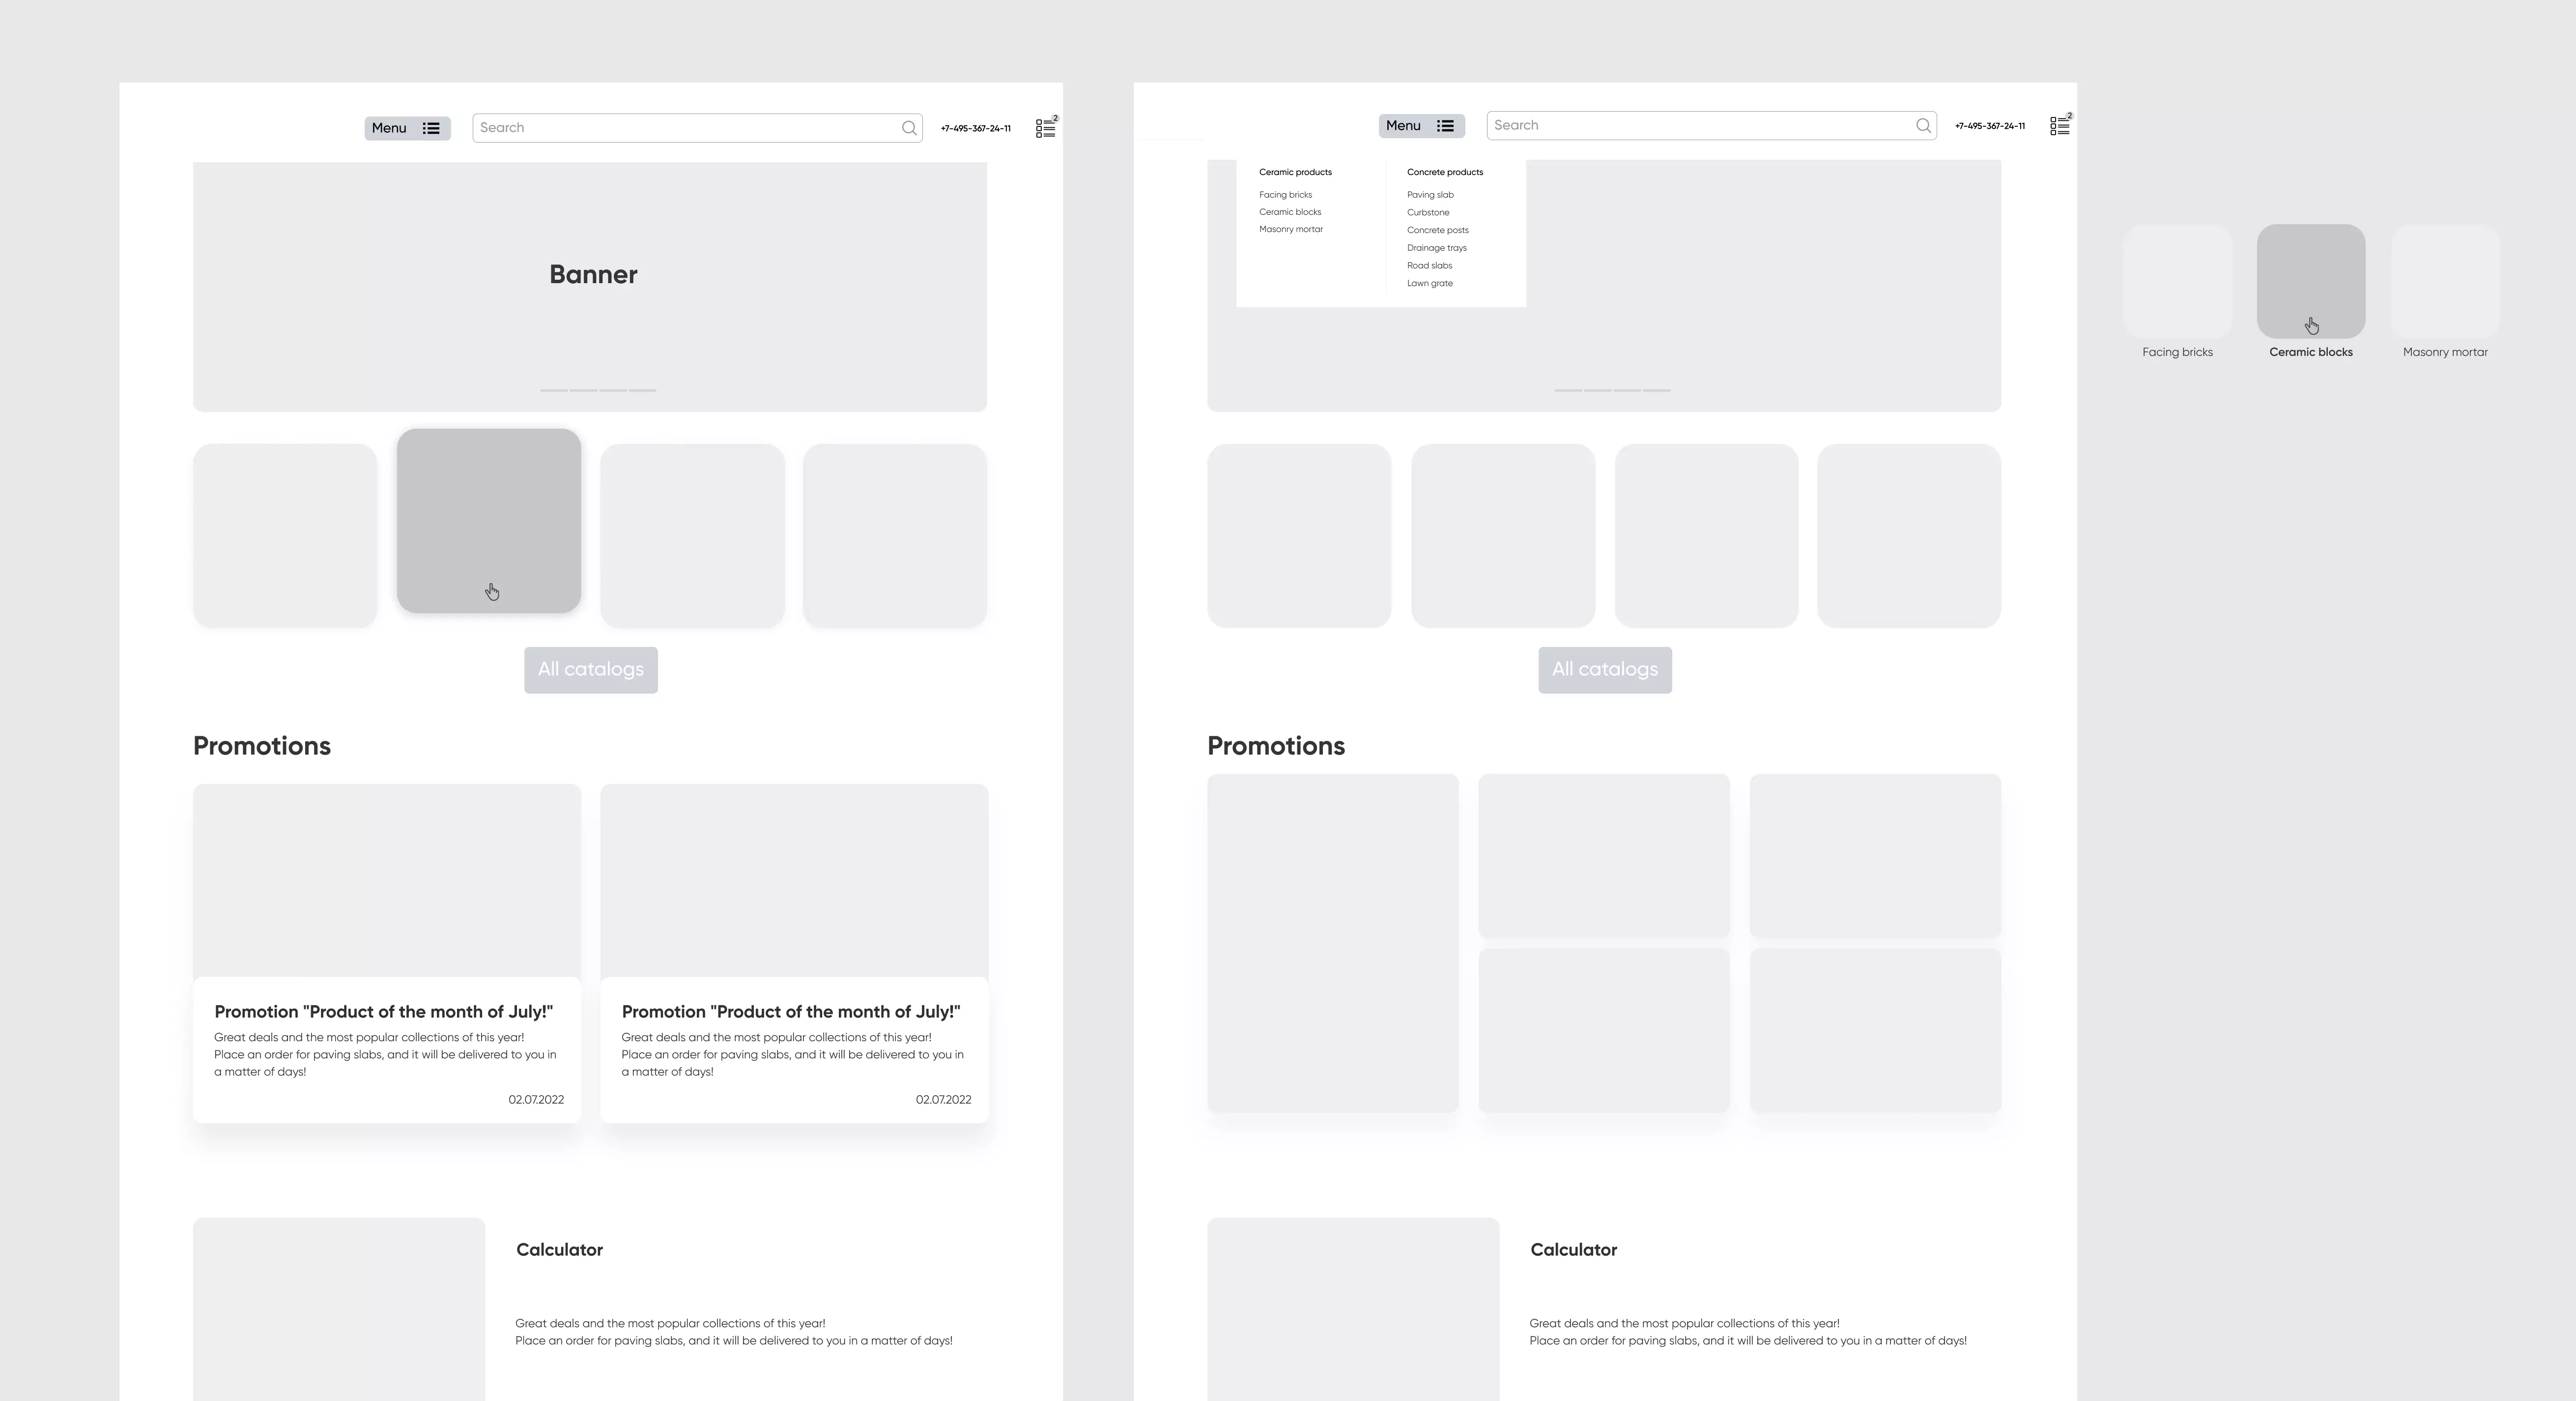
After the client has approved the prototype, software development can begin. And since we have conducted analytics, this development will be based on facts and figures, analysis of competitors and the needs of the target audience. And vice versa: by refusing pre-project research, we rely only on the personal opinion of the customer and the development team. Returning to our example with a laptop, it is almost the same as going into a store and taking the first model that comes across, and then finding out that this is not at all what you need.